![]() Mission
Mission
![]() Technical Summary
Technical Summary
![]() Sample Images
Sample Images
![]() Orbital Characteristics
Orbital Characteristics
![]() Data Availability
Data Availability
![]() Data Continuity
Data Continuity
![]() Geographical Coverage
Geographical Coverage
![]() Ground Station Acquisition
Periods
Ground Station Acquisition
Periods
![]() Spectral Characteristics
Spectral Characteristics
![]() Radiometric Characteristics
Radiometric Characteristics
![]() Geometric Characteristics
Geometric Characteristics
![]() European Products (acquired over Europe)
European Products (acquired over Europe)
![]() Worldwide Products (acquired outside Europe)
Worldwide Products (acquired outside Europe)
![]() 10-Year Old U.S. Data Products
10-Year Old U.S. Data Products
You can also download a "menu-driven" version of this information; it will let you download the information page by page.
![]()
The first LANDSAT satellite was launched in 1972, since then a further four satellites have been successfully launched. The first three, first generation, satellites carried two sensors - the Return Beam Vidicon (RBV) camera and the Multispectral Scanner (MSS). Due to technical problems with the RBV and the spectral and radiometric superiority of MSS, RBV data were seldom used. The second generation of LANDSAT satellites, initiated in 1982 with the launch of LANDSAT 4, carries a Thematic Mapper (TM) in addition to the MSS. In 1993, LANDSAT 6 was unfortunately lost immediately after launch. LANDSAT 7, equipped with an enhanced Thematic Mapper as well as a new high resolution scanner, was launched in April 1999.
More details on Landsat 7 can be found here shortly.
According to current estimates based on the performance of the systems and sensors on LANDSAT 5, the continuity of Thematic Mapper data should be assured well into the next century.
![]()
| Satellite | Launch | Altitude | Inclination |
| LANDSAT 4 | 1982 | 705.3 | 98.2° |
| LANDSAT 5 | 1984 | 705.3 | 98.2° |
| Thematic Mapper | |||||||
|---|---|---|---|---|---|---|---|
| Bands | 1 | 2 | 3 | 4 | 5 | 6 (Thermal IR) | 7 |
| Frequency | 0.45 - 0.52 | 0.52 - 0.60 | 0.63 - 0.69 | 0.76 - 0.90 | 1.55 - 1.75 | 10.42 - 12.50 | 2.08 - 2.35 |
| GSD (m) | 30 | 30 | 30 | 30 | 30 | 120 | 30 |
| Multi-Spectral Scanner | |||||||
| Bands | 1 | 2 | 3 | 4 | |||
| Frequency | 0.5 - 0.6 | 0.6 - 0.7 | 0.7 - 0.8 | 0.8 - 1.1 | |||
| GSD (m) | 80 | 80 | 80 | 80 | |||
| Both | |||||||
| Scene Size (Km) | Revisit interval (days) | ||||||
| 183 x 172 | 16 at equator, 8 at ± 60° latitude | ||||||
![]()
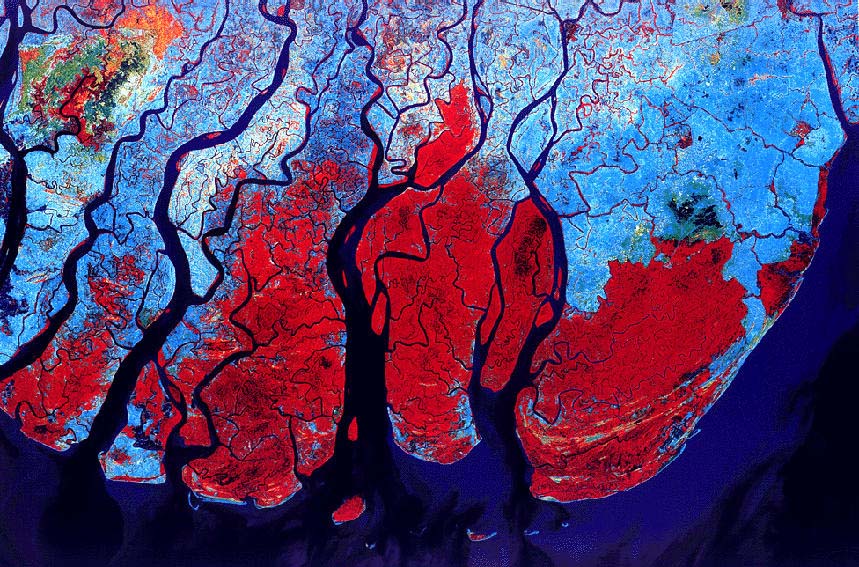
This beautiful image of the delta of the Irrawaddy River in southern Burmah (Myanmar) was acquired by Landsat 5. Landsat sees the earth in both the visible and the infrared parts of the spectrum and here data are combined from both to create an image that is colour-sensitive to varying vegetation types. Thus the mangrove swamps are in red, the slightly higher ground to the Northeast is covered in mixed vegetation, which here appears in orange, red and green, and the various types of grasses, the most prevalent being rice, are in blue/green. Man-made features, in this often flooded area, are almost absent.
The image measures about 130 x 85 km and is part of a full Landsat Thematic Mapper (TM) scene of 185 x 170 km. The Landsat TM sensor has a ground resolution of about 30 metres, meaning that it ³sees² the earth in picture elements (pixels) about 30 metres square. Each of the seven spectral bands in the sensor measures the average amount of the light from the sun that is reflected in each pixel. The image is created by combining the data from three of the bands (4, 5 and 3) as the red, green and blue components of a colour image.
Click on the image to download a 168 Kb JPEG.
Image copyright © EOSAT 1995, Eurimage 1995
Every one of the seven bands of Thematic Mapper data gives different information. To demonstrate this, in these three images we have combined the six high-resloution TM bands in a variety of combinations.

Click on the image to download a 168 Kb JPEG. Brno, Czech Republic - RGB = 321
|
In the first combination, RGB = 321, the image created is almost in its natural colours, as the spectral range of TM bands 1, 2 and 3 covers most of the spectral range visible to the human eye, and the order of inclusion of the bands in the data is the same as in the normal spectrum (i.e. green has a lower frequency than red, which has a lower frequency than blue).
Thus, forested areas are green and fields are a patchwork of green and brown. Man-made objects, such as the roads and the city of Brno, are grey, and while the lake towards the southern edge of the image is perhaps a little greener than it would be as seen through human eyes, in general the impression is very much that of looking down from an aeroplane. |
| In the second combination, RGB = 453, bands 4 and 5 are in the near infrared. Vegetation is a good reflector of infrared radiation, but the amount reflected varies according to the plant species, the state of growth and the biomass.
Thus this image shows much greater differentiation between the fields, in this summer image. An expert can identify different species and assess the seasonal growth rate using images such as this. |

Click on the image to download a 197 Kb JPEG. Brno, Czech Republic - RGB = 453
|

Brno, Czech Republic - RGB = 742 Click on the image to download a 181 Kb JPEG.
|
In the third combination, RGB = 742, the band allocation differentiates between growing vegetation in green (with a strong reflectance in the infrared) and bare earth or rocks in various shades of red and pink. |
All three images copyright © ESA 1995, Eurimage 1995
If you would like to download a page showing all three JPEG images just click here.
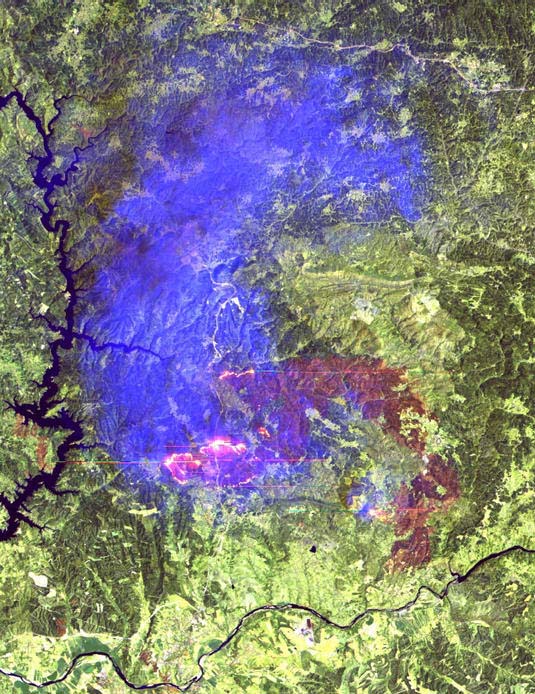 Landsat´s ability to differentiate vegetation types and growth levels enables us to clearly identify burnt vegetation. This applies not only after a fire has burnt itself out, but also while the fire is burning, as we can limit the use of the visible spectrum bands that are especially sensitive to smoke and steam. A good combination to use is RGB = 752, as band 7 is sensitive to flames and hot soil, and band 5 to flames and vegetation change, while band 2 gives the visible component.
In this image of Macao in Portugal, acquired on 5th August 1995, a forest fire is still raging. The firefronts (the largest is more than 5 kms long) are clearly visible, and although some smoke can be seen, it does not significantly hide the ground detail. The infrared bands, particularly band 7, have "saturated" at the hot spots in the fire, giving characteristic lines at right angles to the axis of the sensor.
The image measures about 25 x 20 km, and the area already burned, seen here in brown, is clearly extensive. When a fire is out and the smoke has dispersed, it is possible to use an image such as this to measure the area damaged, without expensive ground surveys.
Click on the image to download a 140 Kb JPEG.
Image copyright © ESA 1995, Eurimage 1995
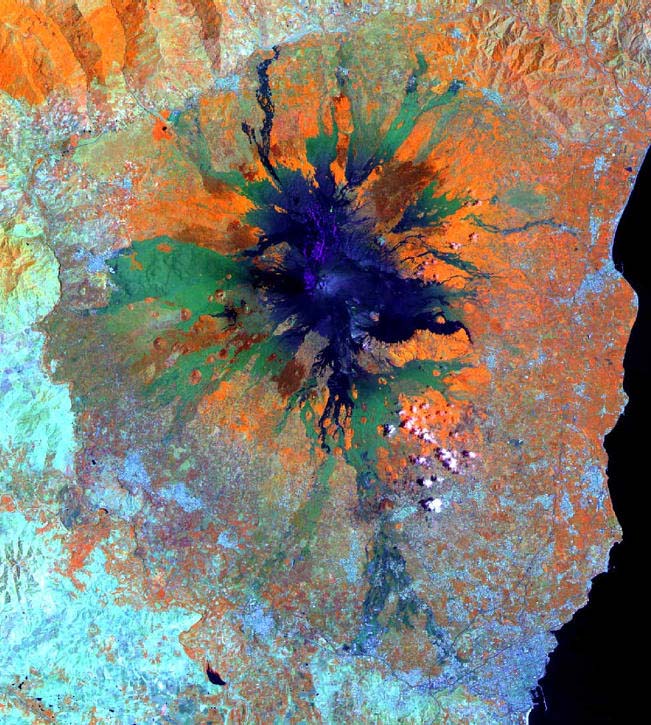 Combining RGB as 453 in a volcanic area produces spectacular results, as can be seen here. The infra-red bands reveal not only the different geological origin of different land forms, but also the different vegetation regrowth rates on the surface of the lava after it has cooled. Thus it is easily possible to trace the paths of the various lava flows that have poured down the mountain´s sides in recent times.
Click on the image to download a 169 Kb JPEG.
Image copyright © ESA 1996, Eurimage 1996
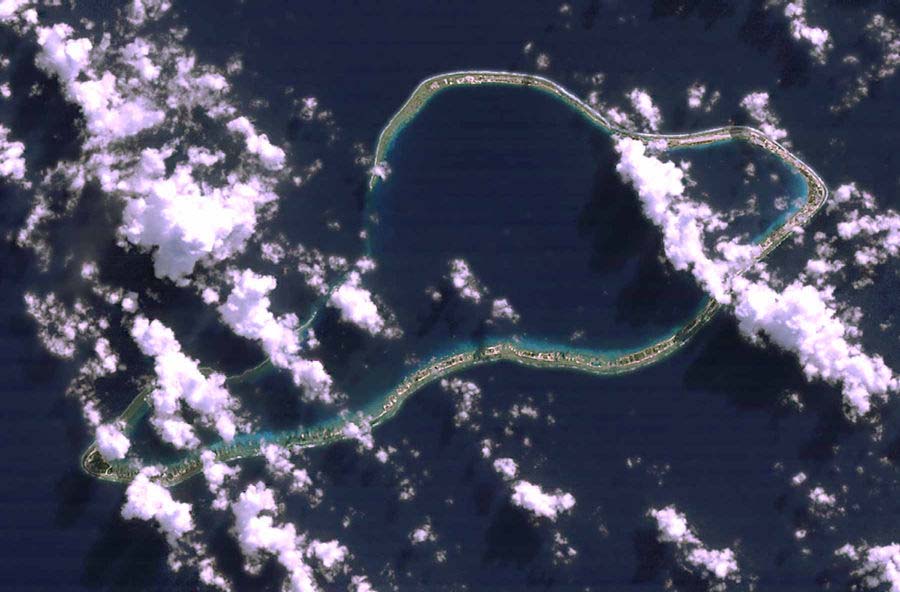 A coral island bathes in the warm waters of the Pacific Ocean beneath the characteristic trade wind clouds that blow almost always from the East. Bands 321 give us a near-natural RGB image, in which the application of various filtering techniques allow some detail to be picked out on the irregular ring of coral that forms this island.
Click on the image to download a 95 Kb JPEG.
Image copyright © EOSAT 1995, Eurimage 1995
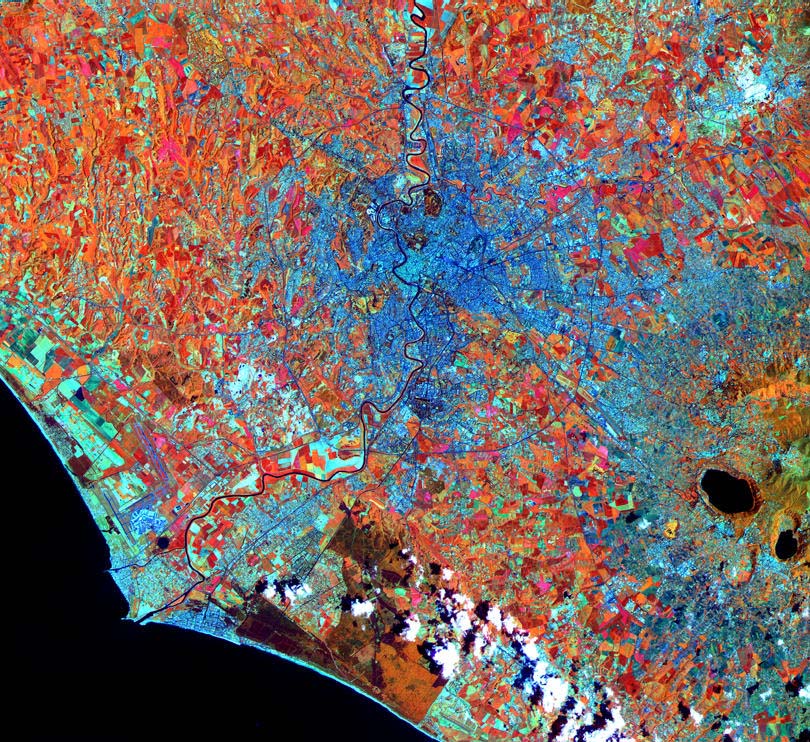 The Eternal City of Rome lies in the sunshine with just a few clouds stretched across the Pontine Marshes to the south. The River Tiber snakes through the city to the Tyrrhenian Sea at Ostia. All the urban areas appear blue in this RGB = 453 image, while the fields and woods around the city are in various shades of red and brown. Lakes Albani and Nemi (the smaller) to the southeast, lie in old volcanic craters that tell the story of Rome's volcanic pre-history. Interesting features to look for are Rome's motorway ring, the "Grande Raccordo Anulare" and it's two airports: Fiumicino near the mouth of the Tiber and the smaller Ciampino beside the road leading to the lakes.
Note also how the colours representing vegetation, change according to the area, revealing different crop types and growth. For example, the grass and woodlands of the Alban Hills around the lakes are more uniformly brown and green, while light greens and blues occur only along the course of the river. Experts can use these data to estimate crop acreages and predict harvest dates.
Click on the image to download a 332 Kb JPEG.
Image copyright © ESA 1996, Eurimage 1996
![]()
The LANDSAT satellites have repetitive, circular, sun-synchronous, near-polar orbits. They provide full coverage between 81°N and 81°S.
The repeat cycle for LANDSAT 1 - 3 was 18 days. Calendars of passes for LANDSAT 5 are always available from Eurimage Customer Services, but the recent calendars are given here:
At the equator, the ground track separation is 172 km, with a 7.6% overlap between adjacent tracks. This overlap gradually increases as the satellites approach the poles, reaching 54% at 60% latitude.
![]()
Multi-Spectral Scanner (MSS) and Thematic Mapper (TM) data are available. There are three categories of LANDSAT data available: European, Worldwide and 10-Year-Old, with pricing differences between the two categories, as well as minor differences in the Geocoded products.
Eurimage distributes, in Europe, North Africa and the Middle East, LANDSAT data received at the European Space Agency ground receiving stations of Fucino (Italy), Kiruna (Sweden) and Maspalomas (Canary Islands, Spain). These stations provide coverage of Western and Eastern Europe, North and West Africa and northern parts of the Middle East. The archive contains MSS data dating back to 1975 and TM data dating back to the beginning of 1985
Eurimage can also supply Worldwide (non-European) data from international ground stations, dating from the beginning of MSS and TM reception. There are small variations in data formats and pricing, depending on the ground station, although the majority of these have signed an agreement with EOSAT to produce data in standard formats at an agreed price. The information given in this guide applies to these latter stations; full details of any variances in formats can be provided once the required ground station has been identified.
The third category of data arises as a result of a U.S. Government policy decision to make LANDSAT TM scenes which were acquired more than 10 years ago over America available in the public domain at the cost of reproduction. This is a rolling 10-year period, the scenes being made available daily from this archive as they reach 10 years of age. The scenes available are mainly over America, although the archive does contain some data over Europe and other areas in the world from various acquisition campaigns. MSS data acquired between July 1972 and October 1992 is also available.
Data from the MSS, which was first used on LANDSAT 1 in 1972, have not been regularly acquired by any ground station since 1994. Archived data are available.
For all three data categories both digital and photographic products are available. For photographic products it is necessary to assign one band to each of the red, green and blue channels in the image; for MSS photographic products, LANDSAT 4 and 5 band combinations 4-2-1 or 431 are available. For TM photographic products all bands can be used in any combination.
![]()
As at 1st November 1996 LANDSAT 4 was in standby mode after 11 years of productive life (on standby since July 1993) and LANDSAT 5 was continuing to transmit high quality data more than 12 years after its launch. All systems and sensors are operating nominally, and the trend analysis of the degradation in the systems and sensors shows no predicted failure before the year 2000. Provided no unexpected event occurs, the loss of LANDSAT 6 immediately after launch in October 1993 will not mean a loss of LANDSAT TM data continuity, as LANDSAT 7 is due to be launched in May 1998.
A series of successful orbital manoeuvres to reverse a drift in the satellite's equatorial crossing time, and to restore it to its nominal value, were carried out by EOSAT, operators of LANDSAT 5, at the end of 1995. This has ensured that acquisition conditions remain comparable with those of the archived data.
![]()
 The 16-day orbital cycle is the basis of LANDSAT's Worldwide Reference System. The WRS is a grid of paths and rows overlaid on a map of the Earth, with the paths representing the ground track of the satellite. The intersections of path and row - nominal scene centres - are used to identify and order LANDSAT images. The coordinate system for LANDSAT 1, 2 and 3 (WRS 1) is different from that of LANDSAT 4 and 5 (WRS2). WRS 2 maps are available from Eurimage Customer Services.
A sketch map indicating the complete current coverage area is above at right (click on the map for a 91 Kb JPEG version).
Please note that a Portable Ground Station was used in Nairobi, Kenya to acquire LANDSAT 5 TM data over Africa in 1994 and 1995.
![]()
Fucino has been acquiring MSS and TM data since 1975 and 1984, respectively. Kiruna started in 1978 and 1984, respectively, but stops acquiring for two or three months each winter. Maspalomas started acquiring MSS data in 1984 and TM data in 1987, but acquisition stopped at the end of 1990. Maspalomas acquisition restarted at the end of March 1994, and continues on a periodic basis. Production of Maspalomas data is currently carried out at Fucino. These stations provide coverage of Western and Eastern Europe, North and West Africa and northern parts of the Middle East.
The table below gives the acquisition periods for LANDSAT 4 and 5. The table differentiates between European and Worldwide Ground Stations; 10-Year-Old U.S. data mainly comes from the U.S. Ground Stations but some other acquisitions are available.
| European | Landsat 4 | Landsat 5 | ||
|---|---|---|---|---|
| Ground Station | Start | End | Start | End |
| Fucino, Italy | Aug-82 | * | Mar-84 | |
| Kiruna, Sweden | Aug-82 | Sep-93 | Mar-84 | |
| Maspalomas, Canary Islands, Spain | - | - | Jul-84 Apr-94 |
Dec-90 |
| Worldwide | Landsat 4 | Landsat 5 | ||
|---|---|---|---|---|
| Ground Station | Start | End | Start | End |
| Alice Springs, Australia | Aug-82 | May-87 | Mar-84 | |
| Bangkok, Thailand | Mar-83 | * | Mar-84 | |
| Beijing, China | - | - | Apr-86 | |
| Buenos Aires, Argentina ** | Dec-82 | Oct-85 | Apr-84 Aug-88 |
Oct-85 Oct-88 |
| Cotopaxi, Ecuador | - | - | Sep-89 | |
| Chung Li, Taiwan | - | - | - | - |
| Cuiaba, Brazil | Aug-82 | Oct-86 | Mar-84 | |
| Gatineau, Canada | - | - | Jun-92 | |
| Goddard, Maryland, USA | Jul-82 | Jun-92 | Mar-84 | Jun-92 |
| Hatoyama, Japan | Oct-82 | * | Mar-84 | |
| Islamabad, Pakistan | - | - | Oct-88 | |
| Parepare, Indonesia | Dec-82 | * | Mar-84 | |
| Norman, Oklahoma, USA | Jun-92 | * | Jun-92 | |
| Johannesburg, South Africa | Aug-82 | * | Mar-84 | |
| Prince Albert, Canada | Aug-82 | Nov-86 | Mar-84 | |
| Riyadh, Saudi Arabia | - | - | Aug-86 | |
| Hyderabad, India | Aug-82 | * | Mar-84 | |
Notes on the table of acquisition periods
![]()
The Thematic Mapper (TM) on LANDSAT 5 is identical to that flown on LANDSAT 4. The TM, which has been in use since 1984, has six spectral bands with a resolution of 30m in the VIS, NIR and SWIR ranges of the spectrum, and a seventh, thermal, band with a resolution of 120m; to provide compatibility with previous data the thermal band is number six.
The MSS has four spectral bands in the visual and near infrared ranges of the spectrum and a resolution of 80 m. Due to the much higher spectral and geometric resolution of the Thematic Mapper instrument, demand for MSS data is much lower; thus the following details relate predominately to Thematic Mapper data.
LANDSAT 7 will carry an enhanced version of the Thematic Mapper scanner, in addition to the standard seven bands, a 15 metre panchromatic scanner in the wavelength 0.50 - 0.90 µ has been added; the thermal band (band 6) resolution will be improved to 60 metres. In place of the MSS instrument LANDSAT 7 will carry HRMSI, a pushbroom, 10 metre, multispectral scanner with the same spectral range as the TM bands 1 - 4, that also includes a 5-metre panchromatic scanner capable of along-track stereo imaging. HRMSI, WITH a 60km swath, is pointable both along and across track.
An on-board, solid-state, recorder will be available to acquire images from parts of the world where direct downlinking is not possible.
![]()
The TM output in each of Bands 1 through 5 and Band 7 have a Signal-to-Noise Ratio (SNR) for specified input as follows:
| Band | Constant in Band Input Radiance (mw/cm2-sr) | Minimum SNR (dB) |
| 1 | 0.28 | 32.00 |
| 2 | 0.24 | 35.00 |
| 3 | 0.13 | 26.00 |
| 4 | 0.19 | 32.00 |
| 5 | 0.08 | 13.00 |
| 7 | 0.05 | 5.00 |
For a constant input radiance, the SNR is defined as the ratio of the output value (in units of radiance), averaged over at least 100 samples, to the rms value of the noise equivalent radiance, that is defined as the rms of the deviations of the output samples from the average value.
The sensitivity of Band 6 is specified in terms of Noise Equivalent Temperature Difference (NETD). The NETD for Band 6 as measured after at least a 6-pixel settling time at 300ºK is 0.º5K. The minimum scene temperature for this band is 260ºK.
TM has an absolute radiometric calibration better than 10% (in LANDSAT 7 this will come down below 5%), unlike its various competitors. To maintain radiometric measurement accuracy for the total mission duration, an internal reference source is used to provide calibration data for ground correction.
The inter-line accuracy for Bands 1-5 and 7 is less than 0.5% of the average output signal of the channel during the scan. For Band 6, this inter-line accuracy is less than 0.5% of the full scale signal.
Inter-band calibration accuracy when operating in the reflective region is better than 2%.
No correction is applied to either TM or MSS data to correct for atmospheric effects. However, if sufficient customers require a specific radiometric correction to be added to the processing chain, Eurimage, with its close relationship with the European Space Agency, and its Operations Department, in regular contact with ground stations around the world, is ideally placed to integrate the required algorithm with the processing chain whenever it is required.
For both TM and MSS data, the quantisation is to 8-bits (256 levels).
![]()
The raw image contains geometric distortions induced by characteristics of the sensor. These characteristics include:
The resulting distortions are modelled and corrected during product processing.
Geometric correction removes geometric distortions in an image based on knowledge of the satellite and sensor, and re-maps the image to a regular grid in a standard map projection. This is accomplished by constructing a mapping between pixel coordinates in the image and geographic coordinates on the surface of the Earth.
The intrinsic geometric characteristics of the sensor, plus the knowledge of the precise orbital and attitude parameters at the moment of acquisition, make it possible to geolocate each pixel with an accuracy down to one half of the GSD (15m for Bands 1-5 and 7).
Three basic levels of geometric processing are available: raw, system corrected or geocoded (levels A, B or C):
LANDSAT raw data is available, in a digital format, for full, quarter and mini scenes for European data, for full and sub-scenes for Worldwide data. A raw data product has no radiometric or geometric correction, but the scan lines are re-aligned in the same across-track direction. In addition, Band 6 pixels are replicated (16x) to unify the geometry of all seven bands.
RAW data needs to be processed with specialised equipment. This format is not suitable for inexperienced users
In addition to the processing of raw data, System Corrected products are corrected for the geometric distortion caused by the Earth's curvature and rotation, the satellite's attitude and the "panoramic distortion" inherent in the scanning geometry. Moreover, radiometric calibration is applied through a look-up table that models the detectors' known non-linearity. System correction uses one of two resampling algorithms (`Cubic Convolution' or `Nearest Neighbour') chosen by the customer when ordering the product; the defaults are Nearest Neighbour for European data and Cubic Convolution for other data (more information about the algorithms is given below, see "Resampling Algorithm").
As the correction process is aiming to represent the curved Earth's surface in the flat plane of a two-dimensional data array, System Corrected products have to use a map projection and Earth ellipsoid to create a model of the earth's form in order to transform the pixels The built-in map projection of European data products is Space Oblique Mercator (SOM), which was developed specifically for use in LANDSAT images because there is no distortion along the relatively narrow band of the satellite track (path). The Earth ellipsoid is GRS 1980.
10-Year-Old U.S. data products are only available to this level of correction.
Further corrections are available with European and Worldwide Geocoded products. These are precision processed products which, in addition to being system corrected, are geometrically rectified according to the customer's specifications with respect to map projection, reference ellipsoid and pixel alignment; furthermore any residual striping is suppressed by filtering and other statistical processing operations. Full details of the projections and ellipsoids that can be used are given in the following pages.
Three levels of geocoding are available, providing different degrees of accuracy of the final product, as follows:
Level A - `Without Ground Control Points'
The information about the orbit and attitude of the satellite which is downlinked along with the image data, is used to geolocate each pixel to a map projection and a reference ellipsoid which are chosen by the customer. The absolute location accuracy is the same as for System Corrected (Path Corrected) products - about 500 m; however, the internal geometry of the image is improved. The orientation of the output image can be `true north', `along track' or any other specified angle.
Level B `With Ground Control Points'
Geometric rectification is carried out using ground control points from maps, or from geodetic or photogrammetric measurements. It is anticipated that maps will be provided by the customer, but Eurimage is able to supply such maps (at cost) if required. The projection and reference ellipsoid of the rectified image will correspond to that of the map unless the customer requests otherwise. The quality of the ground control points directly affects the accuracy of the rectified image. The rms error in the adjusted satellite model is typically half the nominal pixel size, provided that sufficiently accurate control points have been supplied. Terrain displacement errors, which are not corrected by Level B geocoding, are proportional to the instrument viewing angle and the true terrain variation within the image. It should be noted that this correction processing also corrects for non-systematic distortions such as those caused by instantaneous variation of the satellite's pitch and yaw.
Level C `With Ground Control Points plus DTM'
In addition to rectification using control points, images are corrected pixel-by-pixel for local terrain displacement errors by utilising a Digital Terrain Model (DTM); it is anticipated that this will be provided by the customer. The result is a satellite orthoimage. The location accuracy is 15m, even in areas of high terrain.
It should be noted that Worldwide ground stations use different terminology for these processing levels, as does the data centre that processes the 10 Year-Old U.S. data. The details are as follows:
| European | Worldwide | 10-Year-Old U.S. |
| Raw | Path Oriented - Raw data | n/a |
| System corrected | Path Oriented - System corrected | Systematically Geocorrected |
| Geocoded - Level A | Map Oriented - System corrected | n/a |
| Geocoded - Level B | Map Oriented - Precision corrected | n/a |
| Geocoded - Level C | Map Oriented - Terrain corrected | n/a |
For Worldwide Map-Oriented products there are small differences in the detailed processing options available, and these differences sometimes vary from ground station to ground station. The information provided below refers to the processing of European Geocoded products, detailed differences with Worldwide products are indicated. For full details of the processing of the corresponding Worldwide products the customer should ask Eurimage Customer Services at the point in which scenes from Worldwide stations are required; Customer Services will then pass on up-to-date details of the processing carried out at the station in question.
For European Geocoded products the customer can choose from the many projections listed below, the choice being determined by the specific properties to be measured. The default for Geocoded products is UTM:
When ordering Geocoded products some additional information is required with respect to the projections. The table below indicates (with a *) what additional information should be provided when ordering products transformed to a particular projection; for example, when ordering an image transformed to the UTM projection, only the Zone need be specified on the Order Form.
| Map Projection Number (as in above list) | |||||||||||||||||||||||
|---|---|---|---|---|---|---|---|---|---|---|---|---|---|---|---|---|---|---|---|---|---|---|---|
| Information from customer | 1 | 2 | 3 | 4 | 5 | 6 | 7 | 8 | 9 | 10 | 11 | 12 | 13 | 14 | 15 | 16 | 17 | 18 | 19 | 20 | 21 | 22 | 23 |
| Zone | * | * | - | - | - | - | - | - | - | - | - | - | - | - | - | - | - | - | - | - | - | - | - |
| Longitude of central meridian | - | - | * | * | * | - | * | * | * | - | - | - | - | - | - | * | * | * | * | - | - | - | - |
| Latitude of projection origin | - | - | * | * | - | - | * | * | * | - | - | - | - | - | - | - | - | - | - | * | - | - | - |
| Latitude of 1st standard parallel | - | - | * | * | - | - | - | * | - | - | - | - | - | - | - | - | - | - | - | - | - | - | - |
| Latitude of 2nd standard parallel | - | - | * | * | - | - | - | * | - | - | - | - | - | - | - | - | - | - | - | - | - | - | - |
| Latitude of true scale | - | - | - | - | * | - | - | - | - | - | - | - | - | - | - | - | * | - | - | - | - | - | - |
| Scale factor at central meridian | - | - | - | - | - | - | - | - | * | - | - | - | - | - | - | - | - | - | - | - | - | - | - |
| False Easting | - | - | * | * | * | - | * | * | * | * | * | * | * | * | * | * | * | * | * | * | - | - | - |
| False Northing | - | - | * | * | * | - | * | * | * | * | * | * | * | * | * | * | * | * | * | * | - | - | - |
| Longitude of projection centre | - | - | - | - | - | - | - | - | - | * | * | * | * | * | * | - | - | - | - | - | - | - | - |
| Latitude of projection centre | - | - | - | - | - | - | - | - | - | * | * | * | * | * | * | - | - | - | - | - | - | - | - |
| Height of perspective point | - | - | - | - | - | - | - | - | - | - | - | - | - | - | * | - | - | - | - | - | - | - | - |
| Scale factor at projection centre | - | - | - | - | - | - | - | - | - | - | - | - | - | - | - | - | - | - | - | * | - | - | - |
| Longitude of 1st central line point | - | - | - | - | - | - | - | - | - | - | - | - | - | - | - | - | - | - | - | * | - | - | - |
| Latitude of 1st central line point | - | - | - | - | - | - | - | - | - | - | - | - | - | - | - | - | - | - | - | * | - | - | - |
| Longitude of 2nd central line point | - | - | - | - | - | - | - | - | - | - | - | - | - | - | - | - | - | - | - | * | - | - | - |
| Latitude of 2nd central line point | - | - | - | - | - | - | - | - | - | - | - | - | - | - | - | - | - | - | - | * | - | - | - |
The map projection must be associated with an ellipsoid used to model the Earth's shape. The customer can use any Earth ellipsoid from the list given below. The axes are measured in meters. The default for Geocoded products is WGS 84 (the default for Worldwide Map-Oriented products is Clarke 1866).
| Ellipsoid | Major axis | Minor axis |
| Bessel | 6,377,395 | 6,356,079 |
| Clarke 1866 | 6,378,206 | 6,356,584 |
| Clarke 1880 | 6,378,249 | 6,356,515 |
| International 1909 | 6,378,388 | 6,356,912 |
| International 1967 | 6,378,157 | 6,356,772 |
| WGS 66 | 6,378,145 | 6,356,760 |
| WGS 72 | 6,378,135 | 6,356,751 |
| WGS 84 | 6,378,137 | 6,356,752 |
| GRS 1980 | 6,378,137 | 6,356,752 |
| Everest | 6,377,276 | 6,356,075 |
| Modified Everest | 6,377,304 | 6,356,103 |
| Airy | 6,377,563 | 6,356,257 |
| Modified Airy | 6,377,342 | 6,356,036 |
| Walbeck | 6,376,896 | 6,355,835 |
| Southeast Asia | 6,387,155 | 6,356,773 |
| Australian National | 6,378,160 | 6,356,775 |
| Krassovsky | 6,378,245 | 6,356,863 |
| Hough | 6,378,270 | 6,356,794 |
| Mercury 1960 | 6,378,166 | 6,356,784 |
| Modified Mercury 1968 | 6,378,150 | 6,356,768 |
During geometric correction, the input image is resampled to a regular output grid. The resampling kernel specifies how the input pixels are sampled; how many, and how they are weighted. The Resampling Algorithm uses such a kernel to perform radiometric interpolation of the transformed pixels; for LANDSAT TM products this can be specified as one of the following:
Pixel Alignment can also be specified if the customer requires accuracy at the sub-pixel level. The two options available are:
European TM data are offered at an interpolated pixel size of 25 metres, while MSS data are available at a pixel size of 80 metres (the GSD).
The table below provides a comparison between TM raw, System Corrected and Geocoded products:
| Item | Correction | Raw data | System Corrected | Geocoded |
|---|---|---|---|---|
| Basic Data | Scan lines realigned | * | * | * |
| Band 6 pixel size adjusted to 30m |
* | * | * | |
| Earth | Earth rotation | * | * | |
| Earth curvature | * | * | ||
| Terrain variation | Level C | |||
| Orbit | Attitude variations | * | * | |
| Altitude and nadir velocity | * | * | ||
| Sensor | Panoramic distortion | * | * | |
| Detector geometry | * | * | ||
| Sweep non-linearity | * | * | ||
| Map Projection | SOM | * | ||
| Customer defined (Default - UTM) |
* | |||
| Earth Ellipsoid | GRS 1980 | * | ||
| Customer defined (Default - WGS 1864) |
* | |||
| Resampling Algorithm |
Nearest Neighbour | * | * | |
| Cubic Convolution | * | * | ||
| European default: Nearest Neighbour | ||||
| Other Data default: Cubic Convolution | ||||
MSS scenes are available as raw data, system corrected using absolute correction or system corrected using absolute correction plus statistical correction. Further details of these corrections can be supplied if required.
![]()
Eurimage can provide digital products derived from European data, for both MSS and TM sensors. Products are available in different scene sizes, depending, to a certain extent, on the sensor and the source of the data. 10-Year-Old U.S. data are only available in full scene format. The tables that follow give the sizes of the data files in rows and columns; note that each scene or partial scene contains 100 columns of filler appropriately distributed to compensate for the inclination of the scene.
 Full MSS and TM scenes cover approximately 183 x 172 km (MSS scenes are only available in full format). A standard full scene is nominally centred on the intersection between a path and row (the actual image centre can vary by up to 20 km). For a floating full scene the placement is chosen by the customer. The centre point of the floating full scene is defined by the path number and the required latitude (it is usual also to quote the longitude to ensure that the correct scene is provided). The figure above right gives a graphical representation of full and floating scenes.
| Sensor | Standard Format | Rows | Columns | Radiometric Resolution (bits) | Data Volume (Mb) |
| TM | ESA/BSQ | 1+5760 | 7020 | 8 | 40 - 280 |
| MSS | ESA.GS | 3303 | 2278 | 8 | 30 |
| MSS | ESA.BIL | 2286 | 3600 | 8 | 30 |
European TM data (digital or photographic) is available in quadrants, each measuring 94.5 x 88 km. This option is available for raw data, system corrected or geocoded products. Numbering of standard quarter scenes is given in the figure above. For floating quarter scenes the centre of the area of interest is chosen by the customer. However, the floating quarter scene has to remain within the borders of a full floating scene; if necessary the scene will be automatically shifted to allow for this, but will always include the centre of the area of interest.
| Standard Format | Rows | Columns | Radiometric Resolution (bits) | Data Volume (Mb) |
| ESA/BSQ | 1+2944 | 3600 | 8 | 73 |
European digital TM data are available as images covering an area 54.6 x 54.6 km (approximately a 10th of a full scene). This option is available for raw data, system corrected or geocoded products. The scenes are floating and the placement along-path and across-path is chosen by the customer. The centre of the scene is defined by latitude and longitude, in the same way as a floating quarter scene is defined.
| Standard Format | Rows | Columns | Radiometric Resolution (bits) | Data Volume (Mb) |
| ESA/BSQ | 1+1834 | 2284 | 8 | 30 |
![]()
European TM Photographic products, either black and white (one band) or colour composites (three bands, chosen by the customer), are available in full and quarter scenes. The following scales are provided:
| Scale | Full | Quarter | Film Pos | Film Neg | |
| 1:1,000,000 | * | * | * | * | |
| 1:500,000 | * | * | * | Quarter | Quarter |
| 1:250,000 | * | * | * | ||
| 1:125,000 | * | * | |||
| 1:100,000 | * | * |
European MSS photographic products are provided to the same scales as TM products, but only for Full scenes. Eurimage can also provide colour or black and white film and prints of European digital geocoded products when the digital product is ordered at the same time.
![]()
Eurimage has a series of multi-scene products available for LANDSAT TM data.
The Subscription Series is for LANDSAT European data and offers you the possibility of monitoring one or more scenes for a minimum period of four months. Full, Quarter and Mini Scenes can be ordered, and the data provided are digital, system corrected scenes from new acquisitions only.
At the time of placing the order, you specify the acceptable cloud cover (minimum 30%). When the requested data is downlinked from LANDSAT to the ground station, instead of placing it in an archive for subsequent retrieval when an order is placed, the operator immediately checks the cloud cover, and, if it is below the specified limit, the operator transfers the data immediately for processing, quality checking and subsequent mailing by courier. In many cases, the data acquired on one day is dispatched the next morning - the equivalent of Eurimage's Rush Production service.
The discount available for scenes in a Subscription Series is 50% off the corresponding Rush Production price.
Any three or more European LANDSAT TM images over the same area are offered at reduced rates when ordered together. This is available for full and quarter scenes (standard or floating) and for mini scenes. All the images must have been acquired before the date on which the order is placed.
A 50% discount is available on the second scene if you order two European LANDSAT scenes at the same time. Both images must have been acquired before the date on which the order is placed.
A 70% discount is available on the second scene if you order two European LANDSAT scenes at the same time, both scenes having a cloud cover higher than 30%. Both images must have been acquired before the date on which the order is placed. Eurimage Customer Services will carry out the definitive cloud cover assessment when you request the discount.
A set of cloud-free LANDSAT TM images of the whole of one country with just a single order; images ideal for regional planning and management, geology, cartography, and coastal zone management. Sets cover the whole country, and there are also zonal and regional products.
![]() seven bands
seven bands
![]() selected, cloud-free, individual images (not a mosaic)
selected, cloud-free, individual images (not a mosaic)
![]() available on CD-ROM or Exabyte
available on CD-ROM or Exabyte
![]() prices linked to the size of the customer's area of interest.
prices linked to the size of the customer's area of interest.
![]() 'Best of ...' packages are already available for:
'Best of ...' packages are already available for:
During 1997 Eurimage plans to extend these products to at least the following countries:
![]()
Full scenes are available for Worldwide TM and MSS data. TM data is normally delivered in Fast Format, but BSQ can be requested. MSS data is available in BSQ or BIL format.
| Sensor | Standard Format | Rows | Columns | Radiometric Resolution (bits) | Data Volume (Mb) |
| TM | Fast Format | 1+5760 | 7020 | 8 | 280 |
| MSS | BSQ/BIL | 3303 | 2278 | 8 | 30 |
Worldwide TM digital data is available as floating sub-scenes, which are taken from a single path and measure 100 x 100 km. They are ordered by path, latitude and longitude, like European Mini scenes. However, it should be noted that these scenes are sometimes referenced by path and fractional row (percentage shift). For example, Path 33 / Row 22.3 indicates shifting from the top of Path 33 / Row 22 down 30 percent or 51 km along path. Each 0.1 shift equals 17 km.
| Standard Format | Rows | Columns | Radiometric Resolution (bits) | Data Volume (Mb) |
| Fast Format/BSQ | 1+3636 | 3636 | 8 | 93 |
A Map Sheet is a portion of an TM digital scene presented in map-oriented digital format, comprising an area measuring 1/2° latitude by 1° longitude. Minimum ground size for the product is 56 x 112 km. The longer side can be east-west or north-south; the default option is east-west. They also are ordered by path, latitude and longitude.
| Standard Format | Rows | Columns | Radiometric Resolution (bits) | Data Volume (Mb) |
| Fast Format/BSQ | 1+2036 | 4072 | 8 | 60 |
![]()
Worldwide TM data are normally offered at an interpolated pixel size of 25 metres, but are also available at pixel sizes from 17.5 to 30 metres. Worldwide MSS data are offered at a pixel size of 80 metres (the GSD).
![]()
Colour products from Worldwide data are available (EPF process) in full and sub-scenes. The following scales are provided:
| Scale | Full | Quarter/Sub | Film Pos | Film Neg | |
| 1:1,000,000 | * | * | * | * | * |
| 1:500,000 | * | * | * | ||
| 1:250,000 | * | * | * | ||
| 1:125,000 | * | * | |||
| 1:100,000 | * |
For Worldwide MSS products only large scale film products (positive or negative) of full scenes are available.
![]()
The Best of the U.S. product from the Worldwide archive allows the customer to buy high quality, pre-selected, pre-processed, cloud-free scenes, acquired between 1991 and 1993 over the conterminous U.S.A. (Hawaii and Alaska are thus excluded from the offer). The scenes specification is as follows:
| Type: | 7-band LANDSAT TM |
| Processing level: | Path Oriented, System Corrected |
| Map projection: | Space Oblique Mercator |
| Earth ellipsoid: | International Ellipsoid 1909 |
| Pixel size: | 28.5 meter |
| Resample method: | Cubic Convolution |
| Format: | Fast |
| Media: | 6250 bpi CCT, Exabyte, or CD-ROM |
| Notes: | Data listing and Quick Look browse available |
The pricing structure gives reduced prices per scene as the number of scenes ordered increases.
The scenes contained in this offer are 'off the shelf' products. Parameters such as map projection, output pixel size, scene shifts, and format cannot be changed. Scenes cannot be substituted, but media errors will be replaced.
![]()
10-Year-Old U.S. data are only available in full scenes.
10-Year-Old U.S. data for both TM and NSS are now available in a new format with enhanced information on processing. This new format, from the National Landsat Archive Production System (NLAPS) is known as the NLAPS Data Format (NDF).
NDF differs significantly from the formats previously offered and is slightly different from the Fast Format offered for Worldwide Data. Its principal advantage is the addition of two ASCII files: a Work Order Report file and a History and Processing Parameters file, containing additional information about how the data were processed. NDF also allows software companies to have a single ingest routine for both Landsat sensors.
Samples of TM and MSS data in the new format are available in CD-ROM and Exabyte form from Eurimage Customer Services.
As of January 15 1997, 10-Year-Old U.S. data will no longer be available in the old EDIPS format.
| Sensor | Standard Format | Rows | Columns | Radiometric Resolution (bits) | Data Volume (Mb) |
| TM | NDF | 1+5760 | 7020 | 8 | 280 |
| MSS | NDF | 3303 | 2278 | 8 | 30 |
10-Year-Old U.S. data can be ordered as normal full scenes, or as shifted full scenes along the path (from frame n towards frame n+1) in 10% increments. The Scene ID from the archive should be identified and the percentage shift entered in the comments box on the order form.
10-Year-Old U.S. TM data are normally offered at an interpolated pixel size of 28.5 metres, but different pixel sizes can be ordered; if you require a pixel size less than 22.5 metres (in either x or y directions) an additional charge will be made.
10-Year-Old U.S. MSS data are normally offered at an interpolated pixel size of 57 metres, but different pixel sizes can be ordered; if you require a pixel size less than 40 metres (in either x or y directions) an additional charge will be made.
![]()
10-Year-Old U.S. MSS products are available in black and white film (9 x 9 inch), either positive or negative.
No TM Photographic products are available from this archive.
![]()
For a given scene from the 10-Year-Old U.S. data archive, it is possible to order one or two additional adjacent scenes along track and acquired at the same time, at a reduced price; the final product thus being two or three adjacent scenes all acquired at the same time. The chosen scenes can be shifted along track in increments of 10%.
![]()
LANDSAT European digital Products are produced in the ESA Format. The full format description is available in Adobe PDF format.
| To read the document you will thus need to use Adobe Acrobat Reader (3.0 or higher), or the PDF Plug-In for your WWW browser, both available as freeware from Adobe. |
Eurimage offers you four ways to download the format description:
![]()
Up to Welcome Page or back to Products.
Last updated: 13 April 1999